Short read
The problem with carbon labelling - and its solution

Way back in 2009, Raynor Foods calculated the carbon footprint of one of its chicken and bacon sandwiches as part of a Masters project with London Metropolitan University. We were already alive to the implications of greenhouse gas emissions and supported the project to completion, setting us off on a road that we are still treading today – a footprint at a time.
Today, our food supply chains and the broader meta food system that supports them are under sustained duress from a host of pressures of which climate change is just one – but possibly the most urgent and pressing one.
Our industry services an essential requirement for life but contributes a significant proportion of planetary greenhouse gas emissions, so we have no choice but to change.
This places on us, as an industry, a responsibility for driving down emissions and kindling a decarbonising revolution that will eventually result in a sustainable future food system.
Any sustainable food system must also be both commercially and socially sound. Ultimately, the food industry serves the consumer, so encouraging climate-aware consumer choice is an inescapable challenge.
There is evidence that demonstrates consumers do want to make sustainable choices, but the value and effectiveness of that choice is dependent on them being presented with realistic information in an understandable, persuasive form.
This places tremendous importance on how we convey sustainability information to consumers. And the matter is now urgent.
Food carbon labelling – benefits and disadvantages
The urgency with which we must act on this topic is not just generated by the inexorable degradation of our environment. We have an immediate problem with communication.
In the rush to act, companies have generated a thick undergrowth of competing, mutually contradictory, carbon labelling pseudo-standards which risk devaluing efforts at greenhouse gas reduction.
Regardless of the relative merits of these systems, they are rendered ineffective by not aligning to any common underlying standard that permits comparison and informed choice.
Most of these systems sport one or more of the consumer-level communication mechanisms below:
- A score from A to E, or 1-5.
- Carbon per 100g or per kilogram of product.
- Total grams of carbon per product or ‘serving’.
- Descriptors – such as ‘low carbon’ ‘high impact’, ‘moderate impact’.
- Coloured indicators such as ‘red’, ‘orange’, ‘green’.
Presenting customers with an easily understood red, yellow, green rating is a good thing and there must obviously be a degree of simplification involved, but simplification is not what is causing the problem. The issue is comparability.
Unfortunately, companies are free to select their own spectrum of values and to dispose their bandings across that spectrum to suit the relative carbon overheads of their products. The result is a ‘Wild West’ of As, Bs, Cs and traffic lights that bear no relation to those of other manufacturers, rendering comparison with anything but themselves impossible. Oddly enough, there is a predominance of As and Bs (mostly Bs), ‘Lows’ and ‘Mediums’.
To confuse things further, each ‘standard’ is based on its own set of databases of varying reliability and topicality. Averages abound, proxies flourish and measurements are often estimates, or estimates of estimates.
We have, of course, been here before – with nutrition. The value of our Food Information Regulations (FIR) ‘traffic light’ codes and bandings could not have been established without regulation, which was in turn based on a lot of consultation. A voluntary scheme will gather in those who wish to comply, but the door is wide open to exploitation by those who wish to play fast and loose with their definitions.
It is the absence of a regulatory framework that allows the confusion.
What can we do in the meantime?
We can do one obvious thing – work towards a common standard rather than carry on with us all marking our own homework.
In order to arrive at a standard that can support meaningful regulation, we believe the most effective course of action is to try to develop reliable and easily understood benchmarks that will establish a level playing field.
At Raynors, we have opted for a carbon emission comparison system that we believe is robust enough to put forward as the basis for a regulated standard. It requires a little more effort than trawling some databases and drawing parallels, but we think the end result will be worth it.
Defining carbon emissions – introducing S3
The first step is to establish the true emissions overhead of each product. Most proprietary carbon labelling relies on external agencies who apply a mix of databases of carbon measurements, weighting them to get an approximation of true carbon emissions. In many cases, Scope 3 emissions (CO2e - those emissions generated by elements in the supply chain other than the ingredients) are missed out altogether or are once again estimated by trying to find near equivalents.
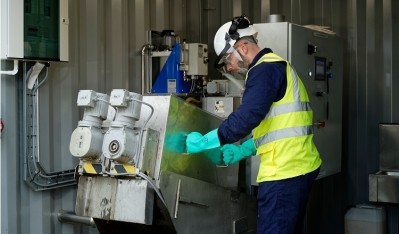
In contrast, Raynors are pioneering a more objective measurement of live carbon footprints. S3 is an Innovate UK funded £2.5m project with the aim of measuring CO2e across a manufacturing enterprise in real time, utilising cutting edge fused digital technologies. Then, by gamifiying the presentation of process data, the workforce and wider staff are incentivised to reduce the operational carbon footprint and are rewarded through recognition, benefits and financial rewards.
Informing the wholesale customer
The S3 project’s key product is dynamic CO2e monitoring. It allows the food manufacturer (Raynor Foods) to report the embedded carbon per delivery consignment to a wholesale customer and, by the end of the project, print bespoke dynamic carbon data onto every product. S3 provides accurate and accredited Scope 3 data to our supply chain customers at the level and granularity they require to meet their reporting requirements on a daily basis and can then pass on a simplified form of the information to every retail customer.
Including the retail customer
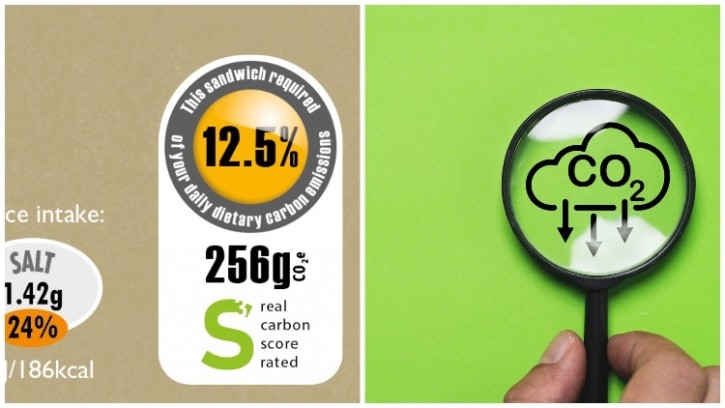
To provide the retail customer with their information we have set up two scales against which our carbon cost results can be compared, establishing objective benchmarks for better consumer understanding. The data is combined in a quick reference, easy-to-understand form: a percentage, a colour and a carbon cost.
How it works
1. The carbon ‘cost’ – a weight in grams per product
Food to go is invariably sold in single servings, making this part of cross-comparisons relatively simple. The simple weight of carbon emissions required to plant, grow, harvest, process the components and then assemble and deliver the item is totalled and displayed in grams. This is the product’s essential ‘carbon footprint’.
2. Daily carbon dietary allowance – a percentage
Once the product’s carbon footprint has been calculated, we can present the result as a percentage of a dietary carbon daily allowance (CDA). Using ONS statistics specifically from for the UK (rather than continental or American sources), we can compute an average British person’s carbon allowance for food intake as much as we can their optimal nutritional intake.
Dividing the carbon content of the sandwich by the CDA provides a percentage. This percentage shows, at a glance, what proportion of your own personal allowable daily carbon footprint is in your lunchtime sandwich.
3. Comparison with real world alternatives – adding a colour band
In our system the traffic light-based colour banding doesn’t just repeat an arbitrary level of carbon, based on a manufacturer’s own range. Instead, it measures the CDA of the sandwich against a basket of options that a lunchtime food-to-go customer might select from.
It makes eminent sense to widen the scope of any banding spectrum for pre-packed sandwiches and wraps to include options like instant noodles, rice pots and sausage rolls because they reflect real world choices.
Crucially, by calculating the footprint of a basket of other comparable lunchtime options (slices, pies, soups, salads, jacket potatoes, etc.) rather than just our own products, we can establish a meaningful basis for comparison.
For example, a product with a relatively high carbon emission rating relative to the basket of lunch options would receive a red rating which indicates that the percentage of CDA shown is a high one for a lunchtime option.
Directly underneath we can show the actual carbon emission total. This helps the casual customer to make wiser choices and gives extra information to the engaged reader.
This gives the consumer a far more realistic base for comparison and eliminates manufacturer bias.
Any industry-wide standard would have to do this. None currently does.
The twin-axis objectivity provided by comparison to both a CDA and the real-world options on offer allows the consumer easily to pinpoint the consequences of their choices, just as clearly and simply as the traffic light scheme for nutrition does.
A broad and immediate guide, with some supporting detail on-pack, backed up by a rigorous framework of tested data, could form the basis of a solid and honest system for defining carbon content.
We’ve come a long way since that first carbon footprint in 2009, and there’s a long way to go, but we may as well start taking steps in the right direction, we hope you will join us.


