In my last column for Food Manufacture, I discussed the recent incident that impacted the retailer Booths, as it discovered a supplier had supplied it product with misleading origin.
Origin fraud is not new. Where there is a price differential, there will always be the incentive for product substitution. In the current market, authenticity risk has increased.
The price differentials post Covid have increased in many cases, businesses are under pressure with higher input costs – particularly in the meat industry which is energy intensive with large sites and vast temperature-controlled areas. At the same time, there is pressure to reduce food cost inflation. Eventually something must give.
With cheaper imported meats available, there are clear opportunities for product substitution.
Origin testing using stable isotope ratio analysis
But all is not lost, there is testing for validation of origin. Stable isotope ratio analysis (also known as SIRA or isotope testing), is a method that has been used extensively in police forensics and archeology to determine where something or someone has come from. This method has been in use in food origin identification for around 15 years.
For this technique, it’s important to note that we only use stable isotopes – and not radioactive isotopes! The reason for this is that stable isotopes pertain a known ratio of heavy and light isotopes in the environment.
What is an isotope?
An isotope is just an atom with different numbers of neutrons (uncharged particles) in its nucleus. So, it’s the same atomic number but a different atomic mass. The mass difference means the heavy and light isotopes behave differently in the environment – either enriched or depleted (more of the heavy isotopes or more of the light isotopes, respectively) in a particular location.
How stable isotope ratio analysis works
Essentially everything that grows picks up an environmental ‘fingerprint’ based on the isotopic profile of the water and nutrients it consumes. By building a database of profiles from known locations we can establish a population of fingerprints, against which we can test unknown samples for consistency with the reference samples of known origin.
It is essential that the reference samples are authentic, in our case for proteins we attend abattoirs and sample beef, pork, chicken, lamb etc., directly from the slaughter line where we can link the samples directly with the paper traceability information to generate our authentic reference datasets. These are maintained and curated on an ongoing basis. Each species must have its own reference database (i.e. a database for beef, pork, chicken, lamb, and so on…).
It is critical that the databases reflect commercial production both in terms of methods and geographical locations. We then sample from a range of potential import locations - the likely substitution origins. With both sets of data, we then use statistical methods to validate the test methods. Providing discrimination can be achieved, an accredited test and interpretation for consistency with samples of known origin can be offered.
The results of analysis
Testing is reported as ‘pass’ – it cannot be statistically differentiated from the reference population; ‘monitor’ – there are some anomalies in the data but it may be an outlier to the population; or ‘warning’ – it is not consistent with the reference population.
There are three possible explanations for a warning result:
- It is from an unsampled or underrepresented area
- Looking at paper traceability information can help with this
- Something has changed in the production system
- For example, a switch from wheat to maize in the diet – this can be checked with feed records
- It is not from where it claims.
Remember, that isotope testing is not a proof of origin test, it is a test for consistency with samples of known origin. The data should be used to target follow-up investigations; for example, it has been used as complementary evidence in court cases.
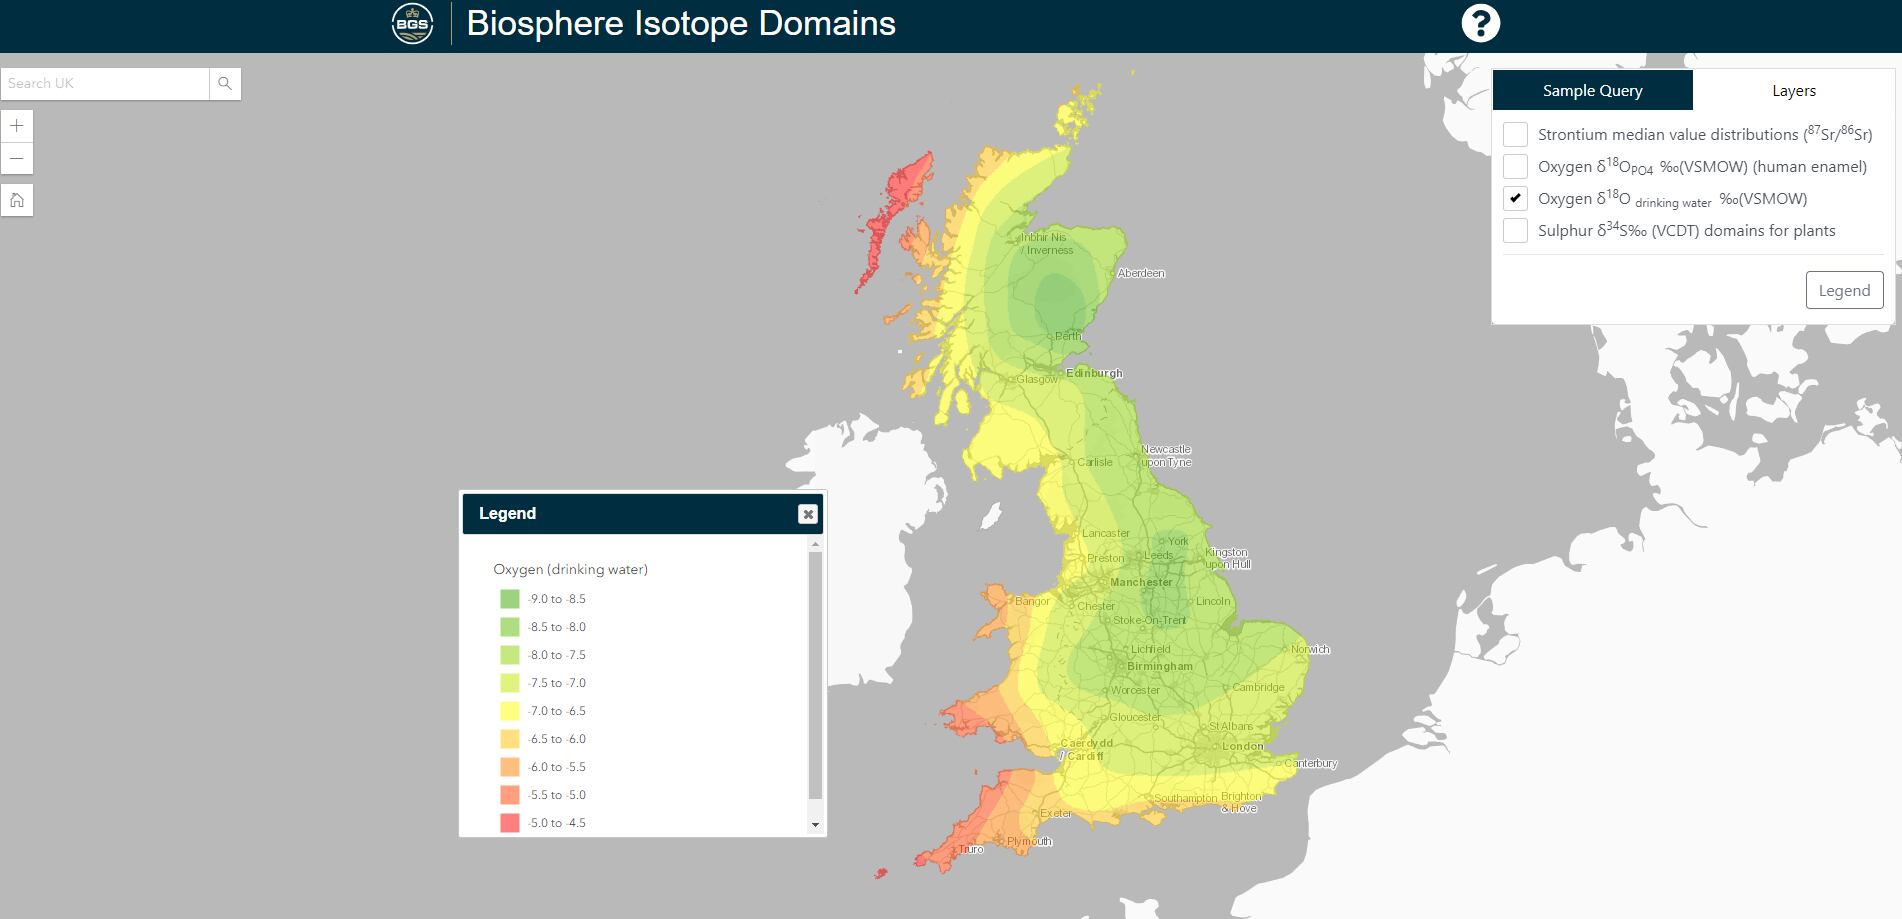
Oxygen isotope map of the British Isles
The prevailing weather is from the South West – heavier isotopes fall closer to the coast with lighter isotopes moving inland and to higher altitudes.
This test works for proteins and produce, and there is a wide range of datasets available. It is important to check how the reference databases have been built and how they are curated to ensure they are fit for purpose for your intended use.


