Quick links
Understanding trends is a crucial part of business, enabling you to tap into new opportunities for growth and engagement.
New trends can emerge very quickly in this TikTok age, and it can often be difficult to keep up and indeed understand which trends are fads and which are worth further investigation.
So we’ve done the hard work for you with this in-depth beverage report which dives into four individual categories: soft drinks, hot drinks, alcoholic drinks, and low and no.
This report is based on electronic point of sale (EPOS) for the year ending March 2025, gathered by Circana and provided to Food Manufacture. Where other data has been collected it is indicated.
Circana collects census store level EPOS data from all the Major Multiple Grocers, as well Boots, Superdrug and for series of symbol groups. The convenience channel also includes some sample data which is used in conjunction with wholesaler data to provide an accurate convenience market read.
Circana process all the EPOS data to create a total market read, adding product attributes by coding products to enable manufacturers and retailers to analyse the performance of their products using a number of different metrics, like value share, volume and average volume price, over different time periods, for example, weeks, months and quarters, usually comparing performance versus last year.
Food Manufacture has also gathered insight from experts in the industry to provide this unique and detailed analysis into the drinks market.
Here you’ll find a general overview of the market and be able to click through to read more about the four individual categories.
Drink reports 2025 - trends at a glance
Macro economic view
The last few years have seen a rise in global uncertainty as a result of geopolitical instability. More recently, US economic policies has served to further rattle the sector, with market confidence wavering, causing depressed investment and consumer spending.
The UK Consumer Price Index including owner occupiers’ housing (CPIH) in May 2025 stood at 4%, increasing from 3.9% in January 2025. The latest ONS figures show that it has risen by 4.1% in the 12 months to June 2025.
The Owner Occupiers Housing inflation index has continued to fall since the start of the year, from 8% to 6.4% (Jan-June).
CPI remained at 3.4% in May 2025, with food and drink big drivers with annual inflation at a 12-month peak of 4.4%. This climbed to 3.6% in June 2025, representing the highest on record since January 2024 when the rate was 4%.
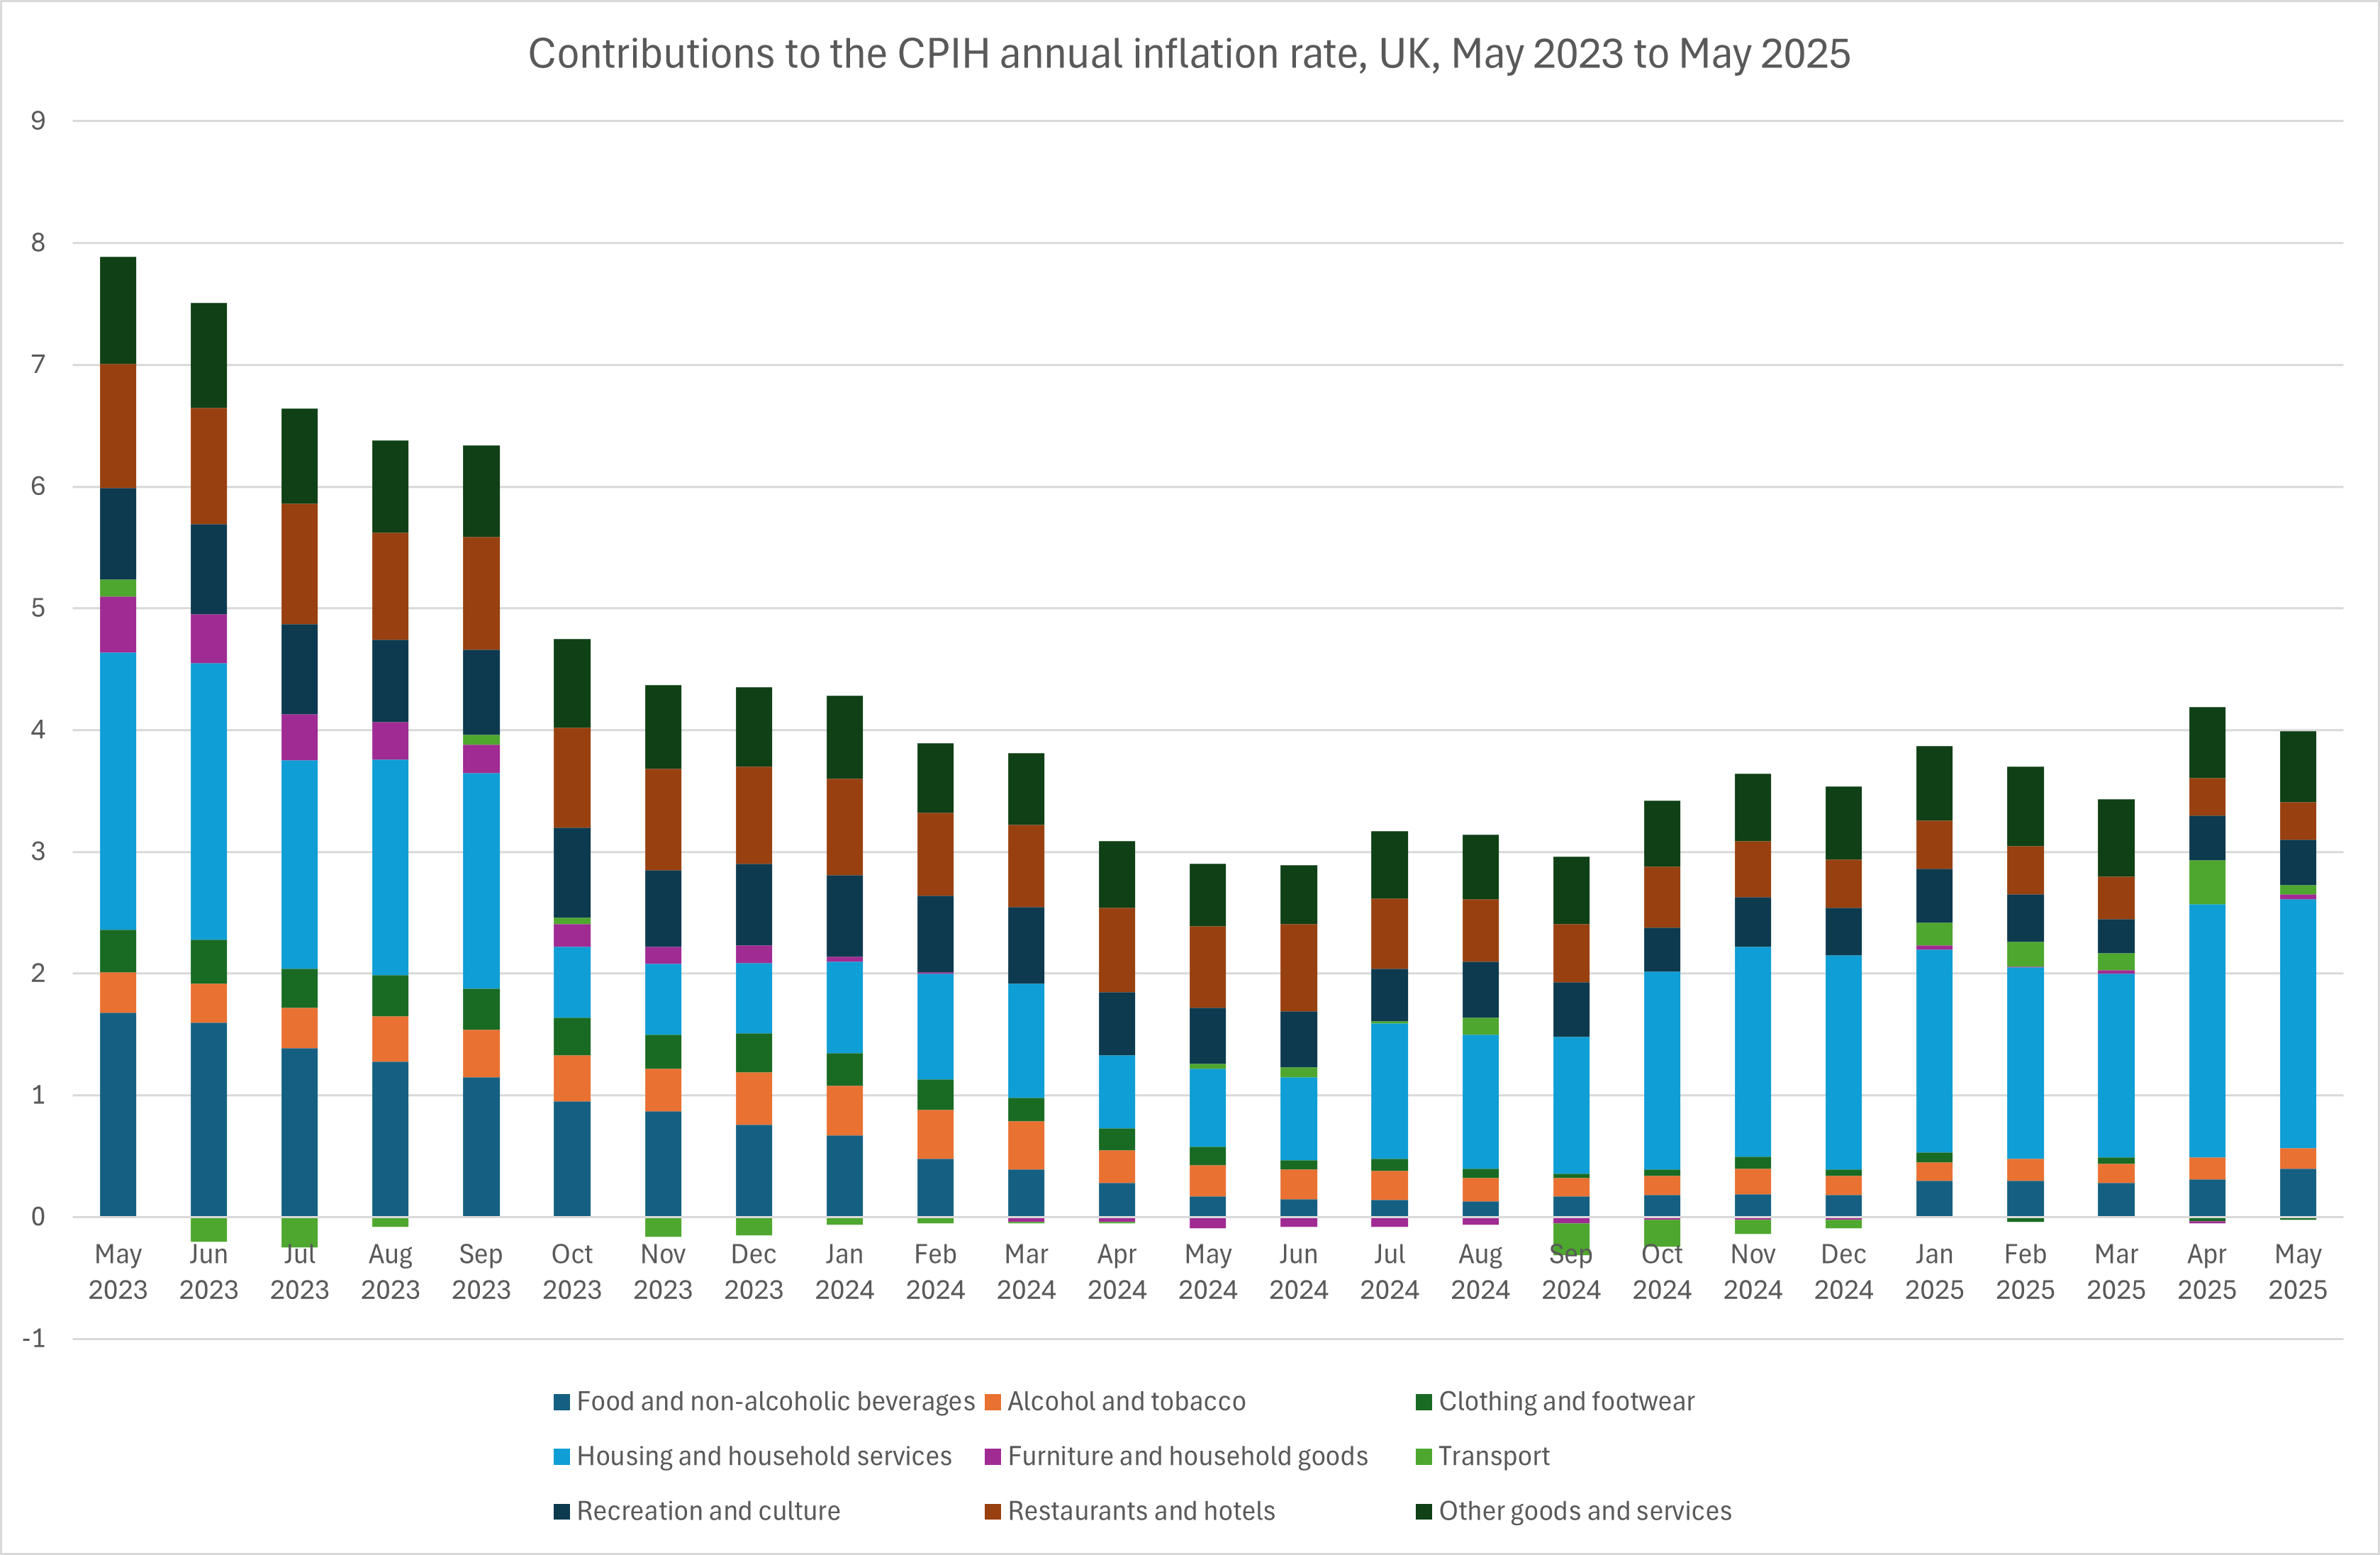
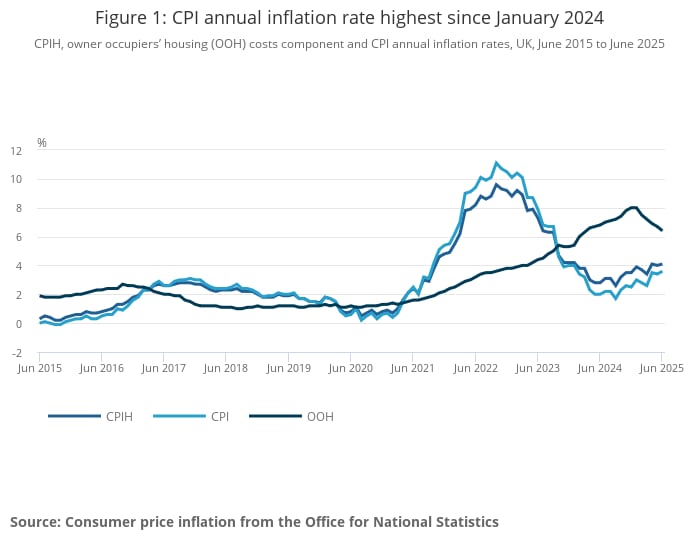
The 12-month inflation rate for food and non-alcoholic beverages was 4.5% last month – the third consecutive month-on-month rise. This is the highest recorded since February 2024, but is well below the peak seen in early 2023 of 19.1%.
Meanwhile the CPI 12-month rate for alcohol and tobacco went from 5.4% in May 2025 to 6.4% in June 2025.
Between February and April 2025, GDP saw an uptick of 0.7% on the previous quarter and by 1.1% on last year. However monthly GDP in April was lower than March by -0.3%.
The Bank of England (BOE) base rate cut (now standing at 4.25%) helped reduce OOH costs, lessening the strain on people’s pockets, but it has warned future cuts will be gradual. However, the speed and depth of cuts remains unclear and with inflation likely to stay high, cuts could even stall.
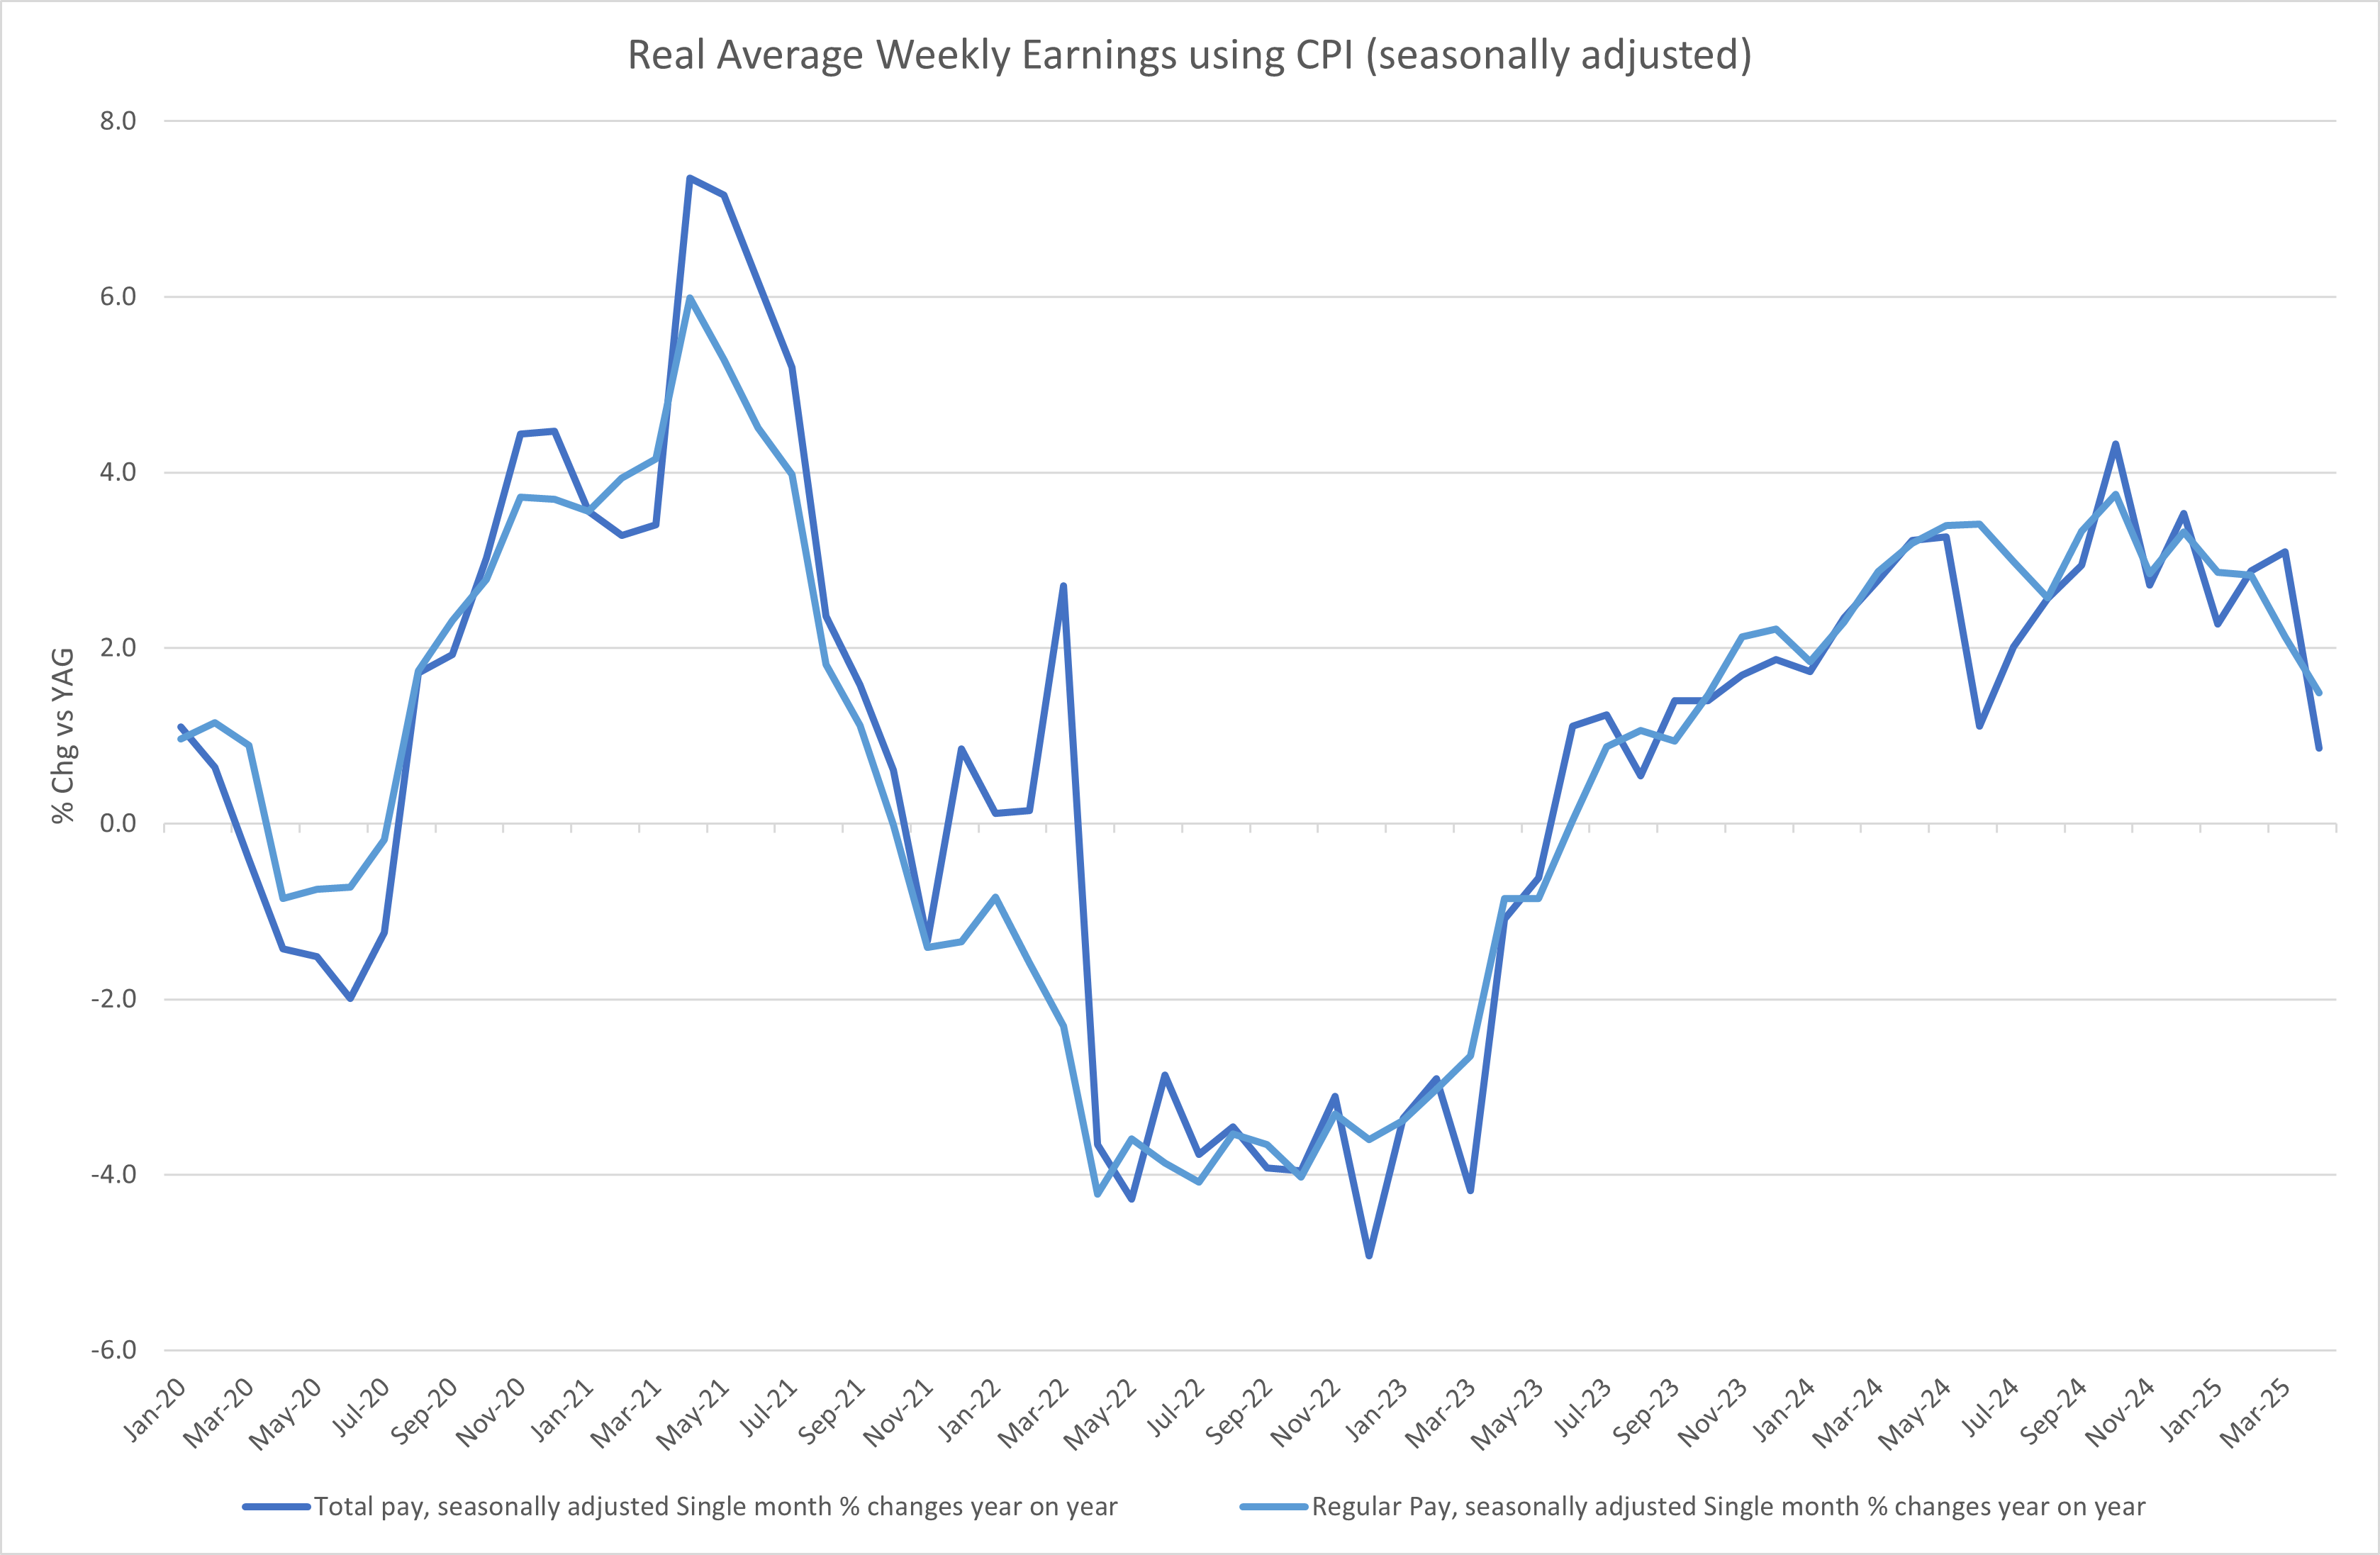
Real average weekly earnings took a sharp fall in April 2025 as inflation and National Insurance (NI) tax (estimated to cost businesses £24 billion a year) increases took hold. Real average weekly earnings remain up on last year over spring, but growth has been slowing since October 2024. Spring 2025 also saw the 2024 Budget cost increases hit businesses for the first time.
Whilst earnings stay ahead of inflation, this isn’t likely to last. As such, more people will take steps to mitigate its impact, meaning that volume will stay soft and trade down and/or buying on promotion will increase.
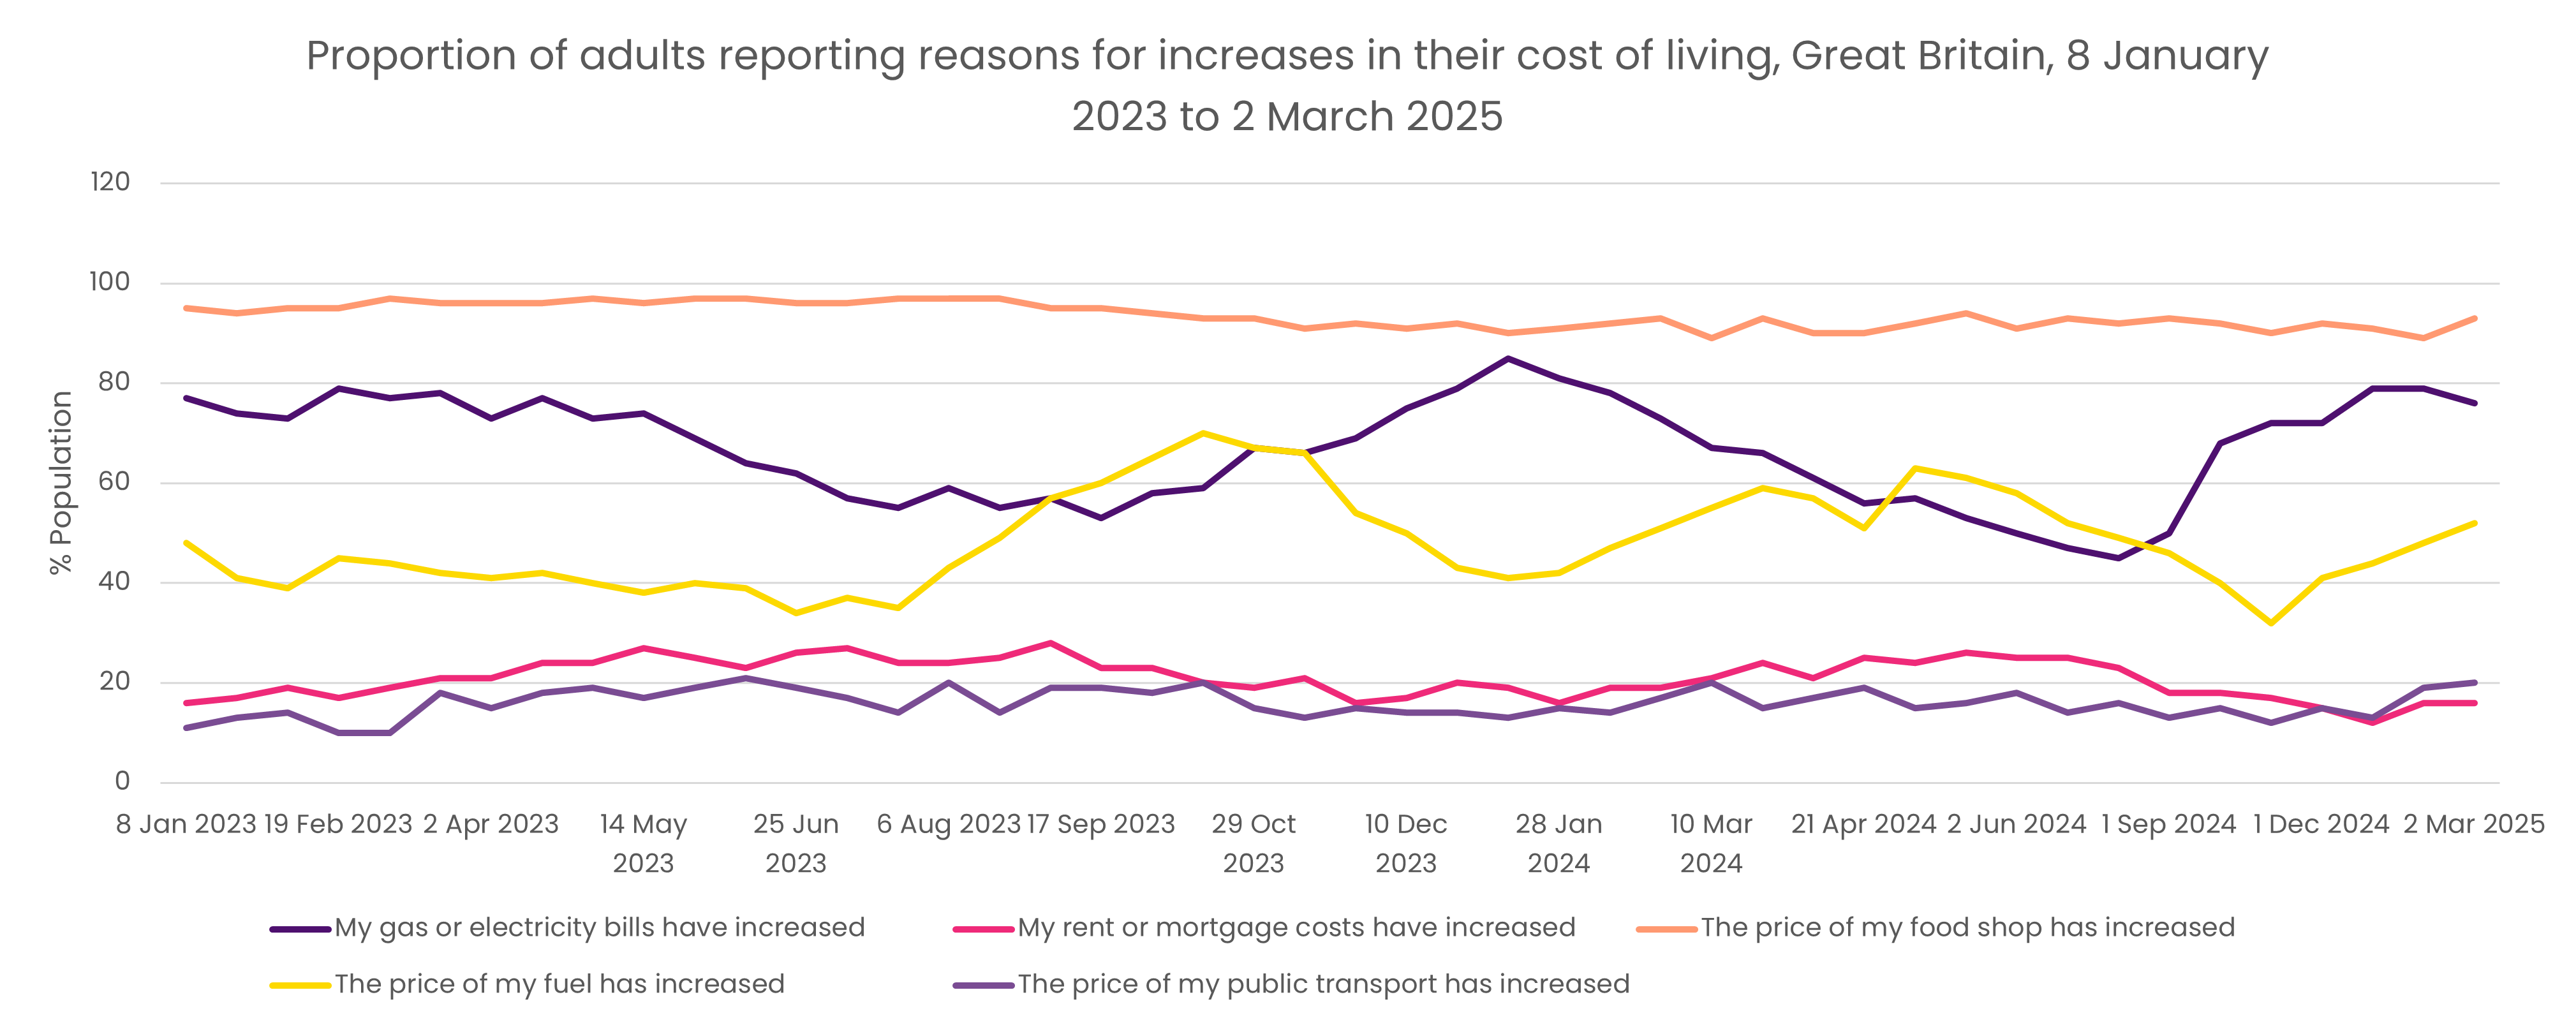
Data from the ONS shows inflation overall has remained steady, but there has been a recent rise in food and non-alcoholic drink prices with the annual inflation rate reaching 4.4% in May 2025 – up from 3.4% in April. This May figure was the highest recorded since February 2024, when the rate was 5%.
Steps to mitigate cost pressures are being taken via reduced food spending, with a growing number of people citing food prices as the reason for the perceived cost of living increase.
Trade deals
June saw the UK and US sign a trade deal, which has seen the UK protected from some of the brunt imposed by the Trump’s tariffs, although question marks remain around steel which could impact prices of goods using this material.
Earlier in the year (May 2025), we saw the UK agree a free trade deal with India, with Scotch and whisky manufacturers set to particularly benefit.
This deal will cut tariffs on whiskies from 150% to 75% when it comes into effect – and this will lower to 40% after 10 years. Soft drinks will also drop from 33% to 0% after seven years.
The UK and EU has also settled on a trade agreement. As part of the deal, a new SPS agreement will make it easier for food and drink manufacturers to import and export goods by reducing red tape.
Since Brexit there has been a 21% drop in exports to the EU and a 7% drop in imports from the trading bloc.
The UK and EU will also collaborate more closely on emissions by linking their respective Emissions Trading Systems.
Combined, the SPS and Emissions Trading Systems linking measures are set to add nearly £9 billion to the UK economy by 2040.
Volume vs spend
The soft drinks category dominates the drinks market volume consumption, with nearly 70% share. However, high average volume prices of alcoholic beverages mean consumer spend is much more equally split. In other words – even though people drink less alcohol by volume, they spend as much money on it as they do soft drinks.
Soft drinks and hot beverages have both seen price increases, but only the former has seen volume growth over the last six months.
Generally, the cost of living has had a knock-on impact on the drinks market, with a correlation between higher average volume price and weaker volume performance.
The category with the lowest volume price – water – has performed best. Meanwhile, functional drinks, including still, juice and dairy based, have bucked the average volume price vs consumption trend, proving to be more price inelastic over the entire 12-month forecast period.
The worse performing category is spirits, with gin the hardest hit. However, there has been growth – albeit slow – in the ready-to-drink (RTD) category.
Supermarkets generally dominate the market over the likes of convenience stores and forecourts – but not on all fronts.
Take home consumption, which sits at 2.2%, is outperforming immediate consumption (-0.8%).
Soft drinks
Soft drink volume is dominated by take-home consumption, with 3.7 times more volume drunk at home.
Despite access to tap water at home, much of the growth in water has come from at-home consumption of packaged water (e.g. bottled).
Health has had a big sway on soft drinks, with growth being driven by functional options such as kombucha and health shots. Those targeting digestive health are seeing a particularly lucrative market and this has also translated to growth in dairy-based drinks.
Meanwhile, flavoured milk and RTD coffee have made big range gains, with new listings and NPD growing.
Read the chapter on soft drinks here. Kindly supported by Blended Products
Hot beverages
Hot beverage growth has been driven by unit price increases with volumes recently slipping into decline Y-o-Y, and the colder winter did little to boost volumes in the short term.
The hot drinks market is dominated by tea and coffee, accounting for 88% of volume and 91% of value. Coffee drives the higher average volume price.
Coffee volume has been boosted by significantly more investment than tea, but units dropped in the last 13 weeks (ending March 2025) verses the year prior as promotional investment reduced Y-o-Y.
Read the chapter on hot drinks here
Alcoholic beverages
Lager dominates the long alcoholic drinks (LAD) market, accounting for 65% of the volume and 60% of the value.
The cost-of-living climate has adversely affected LAD sector performance, with volume decline driving value sales decline.
Wine has been impacted by cost-of-living pressure with volume sales decline driving a value sales decline over the 12-month period.
Spirits are the worst hit category within alcoholic drinks. This category has the highest average volume price. Decline is volume driven and looks to be accelerating.
However, RTD spirits are in growth despite higher average volume price over beer and cider.
Read the chapter on alcoholic beverages here
Low and no beverages
Alcohol-free beer is growing very strongly, reflecting consumer trends towards healthier alternatives.
This category has also seen range gains (i.e. listings and NPD) compared to its counterparts, with craft and speciality ales hit hard.
Low and no spirits are in volume growth but represent just 1% of the spirit volume and value.
With the exception of no and low, all spirit categories have seen price growth Y-o-Y start to slow.


